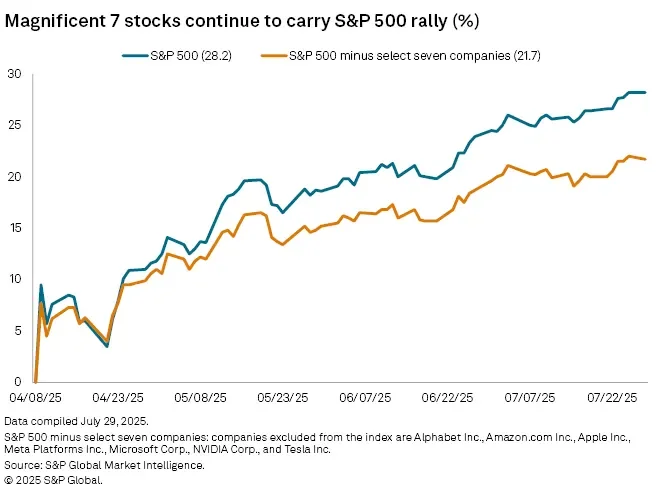
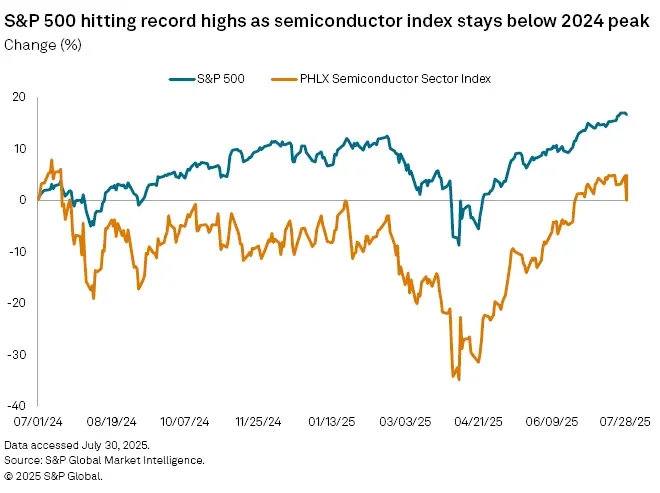
As of May 5, 2026, the S&P 500 continues to scale record territory, yet the architecture of this climb appears increasingly precarious. Market data reveals a widening chasm between index performance and underlying health: the current rally is fueled by a narrowing cohort of semiconductor and mega-cap tech firms, while the broader market participation stagnates.
Recent sessions have seen the index hit record closes despite a majority of constituent stocks failing to keep pace. Only 53 per cent of S&P 500 companies now trade above their 200-day moving averages, a metric that historically serves as a signal for thinning market breadth.
Structural Imbalances and Valuation Metrics
The dependence on a select few stocks—notably those tied to AI and high-compute hardware—has revived comparisons to the late-1990s dot-com era. Analysts point to several persistent indicators of systemic tension:
Read More: Top 10% Americans own 93% of stocks as of May 2026 market report

Valuation Multiples: Much of the index’s growth has been decoupled from corporate profit expansion, relying instead on inflating price-to-earnings (P/E) multiples.
Sector Dispersion: Only six of the S&P 500’s 11 sectors are trading within five per cent of their historical highs, indicating a lack of uniform strength across the economy.
Breadth Divergence: Recent records were established even as the number of declining stocks outnumbered those advancing within the index.
"The robust health of NVIDIA is likely an extreme outlier… the epic climb in stock prices has come almost entirely from surging multiples, rather than corporate profit growth."
The "Bubble" Debate: Memory and Momentum
The current market environment is marked by two conflicting narratives: one driven by the speculative fervor of retail investors—seen in the recent resurgence of "meme stock" trading—and another by institutional caution regarding macroeconomic headwinds.
While some entities like Goldman Sachs refrain from explicitly labeling the situation a bubble, they acknowledge that the high level of concentration and intensified competition within the AI sector create significant risks of a correction. Furthermore, with the total market capitalization reaching roughly 363% of U.S. GDP, some economists argue that current valuations exceed the historical extremes observed during the dot-com bubble.
| Indicator | Status/Observation | Implication |
|---|---|---|
| Market Breadth | Narrow (53% above 200-day MA) | High sensitivity to few assets |
| P/E Ratios | ~30x (GAAP-based) | Earnings lagging price growth |
| Sector Health | 6/11 sectors near highs | Incomplete participation |
| Market Cap | 363% of GDP | Elevated macro-valuation |
Historical Context
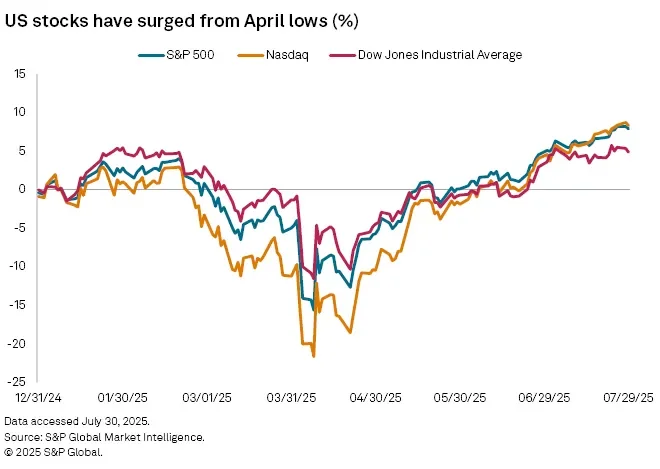
This reliance on tech-led momentum follows a trajectory that began gaining intensity throughout 2025. Investors are navigating a landscape where the primary engines of the bull market—major AI-driven giants—face mounting scrutiny over their ability to sustain current valuation multiples in the face of persistent policy uncertainty and global economic shifts. The current rally, while persistent, remains structurally tethered to a narrow band of capital, heightening the risk should that specific sector volatility accelerate.
Read More: Highway Projects Help Economy But Hurt Small Businesses