
One Large Language Model Accurately Pinpoints a Code Flaw
Recent trials examining the code-debugging capabilities of prominent AI models reveal a significant divergence in their analytical performance. When presented with the same faulty JavaScript snippet, only one model, Claude, reportedly managed to identify the root cause of the error. This development surfaces as the latest in a series of assessments into how artificial intelligence handles the intricate task of software diagnostics.
The claim is that Claude successfully debugged a piece of JavaScript code that ChatGPT and Gemini did not, in a test conducted by a developer on May 16, 2026. The author of the comparison, writing for 'MakeUseOf', noted that while ChatGPT and Gemini also processed the code, their diagnostic output did not reach the same level of accuracy in identifying the core issue.
Developers Forge Ahead with Traditional Debugging Methods
Beyond the capabilities of AI, human developers continue to rely on established practices and tools for JavaScript debugging. A variety of techniques are being employed, ranging from fundamental console outputs to more sophisticated browser functionalities.
Read More: Chrome mimeHandler API lets extensions handle file types
Enhancing Code Clarity and Error Tracking
Efforts are underway to refine how errors are handled and tracked within JavaScript. One proposed method involves leveraging the Error.cause property, a feature designed to create more detailed and navigable error chains.
This approach allows developers to preserve the original error while presenting a clear, overarching message.
Examples demonstrate how
Error.causecan link a top-level error, such as a failure to fetch user data, to the underlying issue, like aSyntaxErrorduring JSON parsing.
This method, detailed in a piece by Matt Smith on November 10, 2025, aims to move away from what has been described as "chaotic" error handling in JavaScript.
A Toolkit of Console Commands
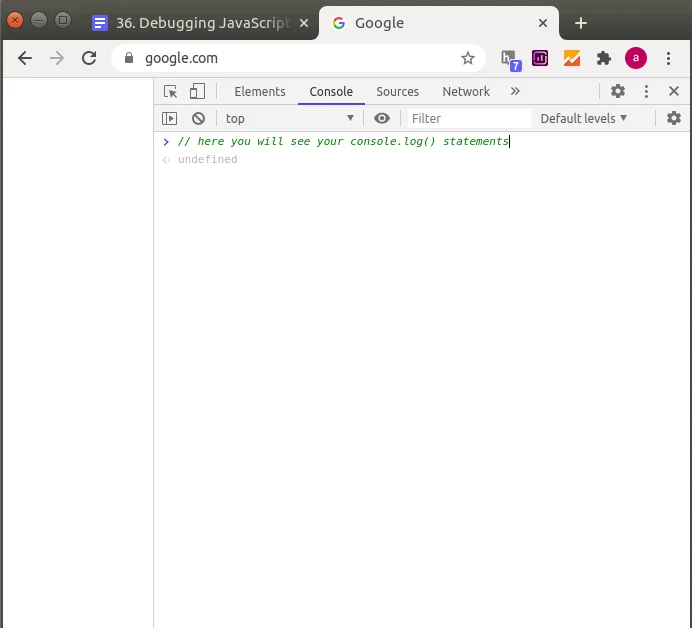
The humble browser console remains a central tool for developers. Beyond simple console.log(), a range of commands offer more nuanced insights:
console.table(): Presents data in a structured, readable table format.console.group()andconsole.groupEnd(): Organizes related log messages.console.time()andconsole.timeEnd(): Measures the duration of specific code operations.console.assert(): Logs messages only when a condition is false, highlighting unexpected outcomes.console.count(): Tracks how many times a particular function or line of code is executed.console.trace(): Displays the call stack, showing the sequence of function calls leading to the current point.console.dir(): Provides a detailed, interactive list of the properties of a JavaScript object.
These methods, as outlined in a recent 'dev.to' article, assist in everything from data display and performance measurement to identifying logical flaws and tracing execution paths.
Leveraging Browser Developer Tools
Modern web browsers offer integrated developer tools that provide powerful debugging capabilities.
Accessing these tools, often via the F12 key, allows developers to examine code execution in real-time.
The
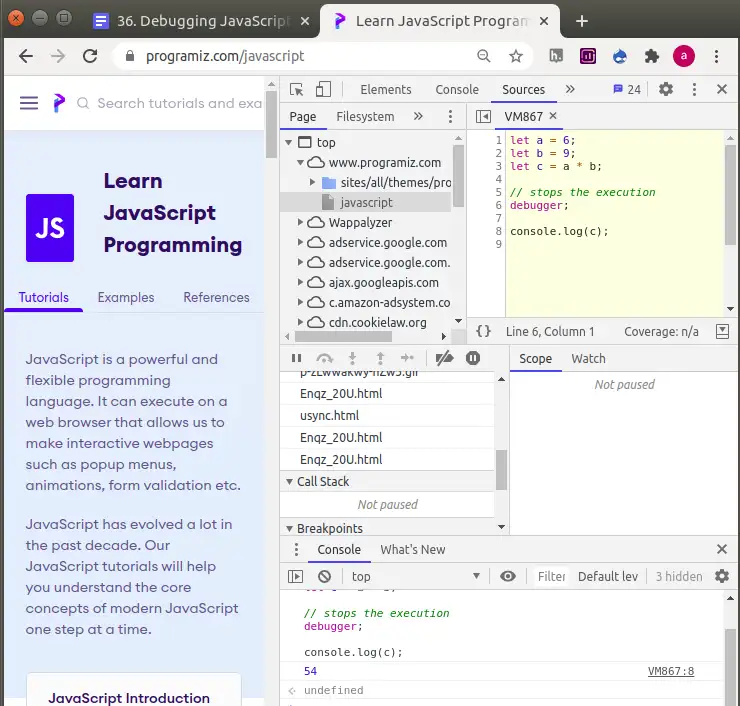
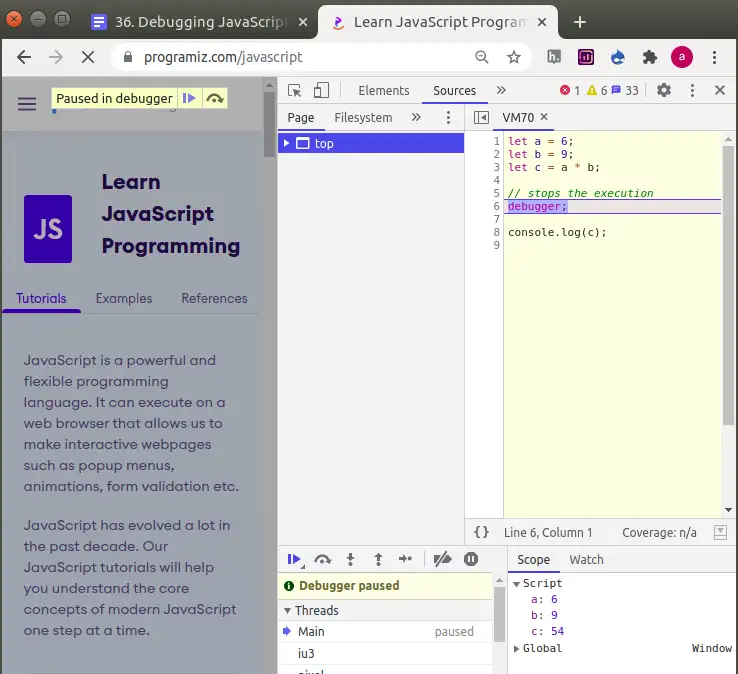
debugger;statement can be inserted directly into code to pause execution at a specific point.Browser tools enable variable inspection, allowing developers to monitor the values of variables as the code runs.
Conditional breakpoints can be set to pause execution only when certain criteria are met, such as a loop counter reaching a specific value.
These functionalities, mentioned across various resources including 'W3Schools' and 'Programiz', underscore the ongoing reliance on direct code inspection and manipulation for problem-solving.
Read More: NVIDIA NIM API Demand Jumps, Developers Want 200 Requests Per Minute
Understanding JavaScript Error Types
JavaScript debugging efforts are often directed at two primary categories of errors:
Syntax Errors: These occur when code violates the fundamental rules of JavaScript grammar, preventing it from running at all. Examples include missing semicolons or mismatched brackets.
Logical Errors: In these cases, the code executes without crashing, but it produces unintended or incorrect results. This often requires careful tracing of the program's flow and data manipulation.
Try…catch blocks are a common mechanism for handling runtime errors, preventing the entire application from failing when an unexpected issue arises. This is particularly useful for operations like parsing data, where the input might be malformed.
Debugging Modern JavaScript Constructs
Specific challenges arise with newer JavaScript features and patterns:
Asynchronous Operations: Debugging code that involves promises or callbacks requires understanding how execution flow is managed over time.
Arrow Functions and
thisBinding: Issues with thethiskeyword in callbacks can lead to unexpected behavior, often requiring adjustments to how functions are defined or bound.State Updates in Frameworks: In environments like React, state updates can be batched, meaning
console.logmight show an outdated value. Functional updates to state setters can resolve this.Minified or Transpiled Code: For code that has been compressed or transformed for deployment, 'source maps' are essential to map the optimized code back to its original, human-readable form for effective debugging.


.jpg)


