The practice of folding fragmented research into a single statistical truth now relies on a specific sequence of R language scripts. Recent documentation detailing the 'meta' and 'metafor' packages reveals a rigid workflow for calculating Standardized Mean Differences (SMD) and relative risks. This technical framework replaces traditional theory with direct execution, using code to force disparate data points into a unified forest plot.
The process requires the installation of five core packages:
meta,Matrix,metafor,readr, andxlsx.Data is ingested via read.csv or read.xlsx, with the system assigning weights to studies based on their precision.
Practitioners must choose between Fixed Effects (for consistent data) and Random Effects (to account for messy, heterogeneous results).
Hunting for the Unspoken
The reliability of these synthesized conclusions depends on identifying what is missing from the public record. The funnel() function maps study distribution to catch "publication bias"—the tendency for negative results to vanish.
"When the number of included studies is greater than or equal to 10, Peters’ test is required over Egger’s test to maintain accuracy without needing arc-sine transformations."
To correct lopsided data, the trim-and-fill method creates "ghost" data points. These simulated studies are added to the funnel plot to see if the overall conclusion holds up when the missing pieces are hypothetically restored.
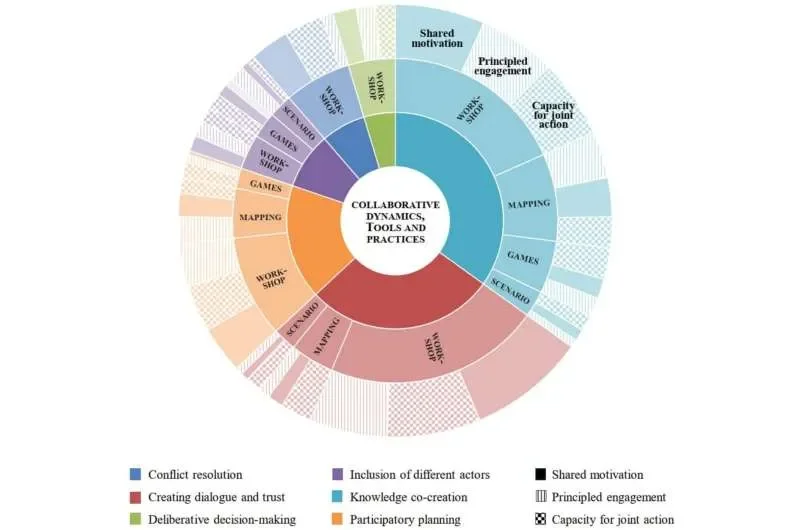
Read More: New Study: Working Together Tools Make Land Planning Better Today
| Feature | Low Heterogeneity ($I^2$) | High Heterogeneity ($I^2$) |
|---|---|---|
| Value Range | 0% - 25% | > 75% |
| Model Choice | Fixed Effects | Random Effects |
| Source of Bias | Minimal | Varied subjects/locales |
| Adjustment | Standard synthesis | Subgroup/Regression |
Testing for Fragility
The framework includes "Sensitivity Analysis" to ensure a single loud study does not distort the average. By using the metainf() command, researchers strip away studies one by one to see if the "truth" survives the removal.
Subgroup Analysis divides data by categories (e.g., Region A vs. Region B) to see if location changes the outcome.
Meta-regression handles continuous variables, such as "publication year," to determine if time itself erodes the effect.
The use of Relative Risk (RR) vs. Odds Ratio (OR) is noted as a point of potential distortion; OR often exaggerates effects when event rates are high.
Background on the Shift
This manual represents a move away from "theory-heavy" academic gatekeeping toward raw, algorithmic synthesis. It frames the meta-analysis as a tool for quick production—promising that a researcher can "finish a paper in the time it takes to drink a cup of tea." By automating the JAMA formatting and bias checks, the messy work of human judgment is shifted onto the R console. This trend treats research not as a narrative, but as a data-mining exercise where the code determines what is significant.